


N-E cities have the strongest feel-good factor
The EOL report has calculated its overall scores on the basis of four parameters: quality of life, economic ability, sustainability and citizen perception.
One of the most intriguing data points in the 2020 Ease of Living (EOL) Index is the gap between perceived and actual ease of living in India’s cities.
")
The EOL report has calculated its overall scores on the basis of four parameters: quality of life, economic ability, sustainability and citizen perception. The last parameter, which has a weight of 30% in the overall rankings, was based on a Citizen Perception Survey (CPS), which asked citizens to “evaluate the role of administration through performance in public service delivery, providing insights directly from the citizens”.
CPS plays a huge role in boosting overall EOL scores. The all-India EOL index is 53.51, but it drops to 30.69 once the CPS scores are deducted.
Is there a pattern to CPS scores being high or low in the country? An HT analysis of the statistics given in the report shows those cities in North-Eastern India -- except Guwahati, they all have a population of less than a million -- have the biggest positive bias, with CPS scores being higher than actual performance indicators.
Cities in southern and western India, which perform the best on the more tangible indicators, have the lowest positive bias in their overall scores on account of CPS. The CPS bias is also higher in smaller cities than larger ones.
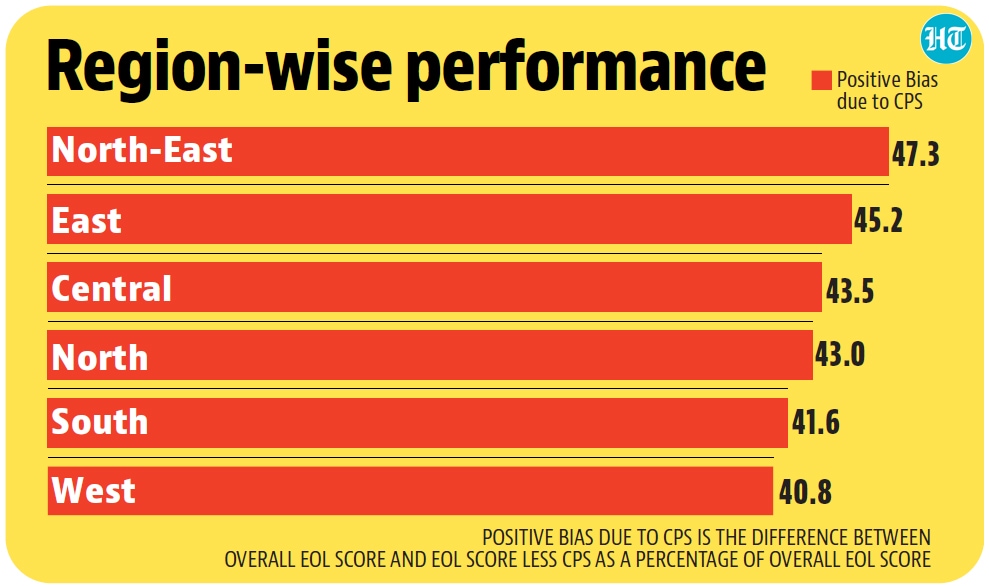
The EOL report has given both overall and CPS excluded scores for all the 111 cities which are part of the survey. A good way to measure the positive bias in overall ranking due to CPS scores is to look at the percentage difference between overall and CPS excluded EOL scores for a city. The higher this number, the bigger will be the positive bias brought about the CPS numbers.
A region-wise analysis shows that this number is highest for cities in the North-East (47.3%) and the lowest for cities in the West (40.8%). The positive bias is also stronger when it comes to cities with less than a million people (43.79%), when compared to those with a population of more than a million (41.52%).
Get Current Updates on India News, Lok Sabha Election 2024 Voting live, Assembly Election 2024 Voting Live, Elections 2024, Election 2024 Date along with Latest News and Top Headlines from India and around the world.
